Near Real-Time TEC Maps, Europe
DLR’s TEC maps for the European region provide information about vertical TEC (VTEC) derived from groundbased GNSS measurements with a latency of not more than 5 minutes and an update rate of 15 minutes. The maps cover the region between 30°N – 72°N and 30°W – 50°E with 2° in latitudes and 2° in longitude spatial resolution.
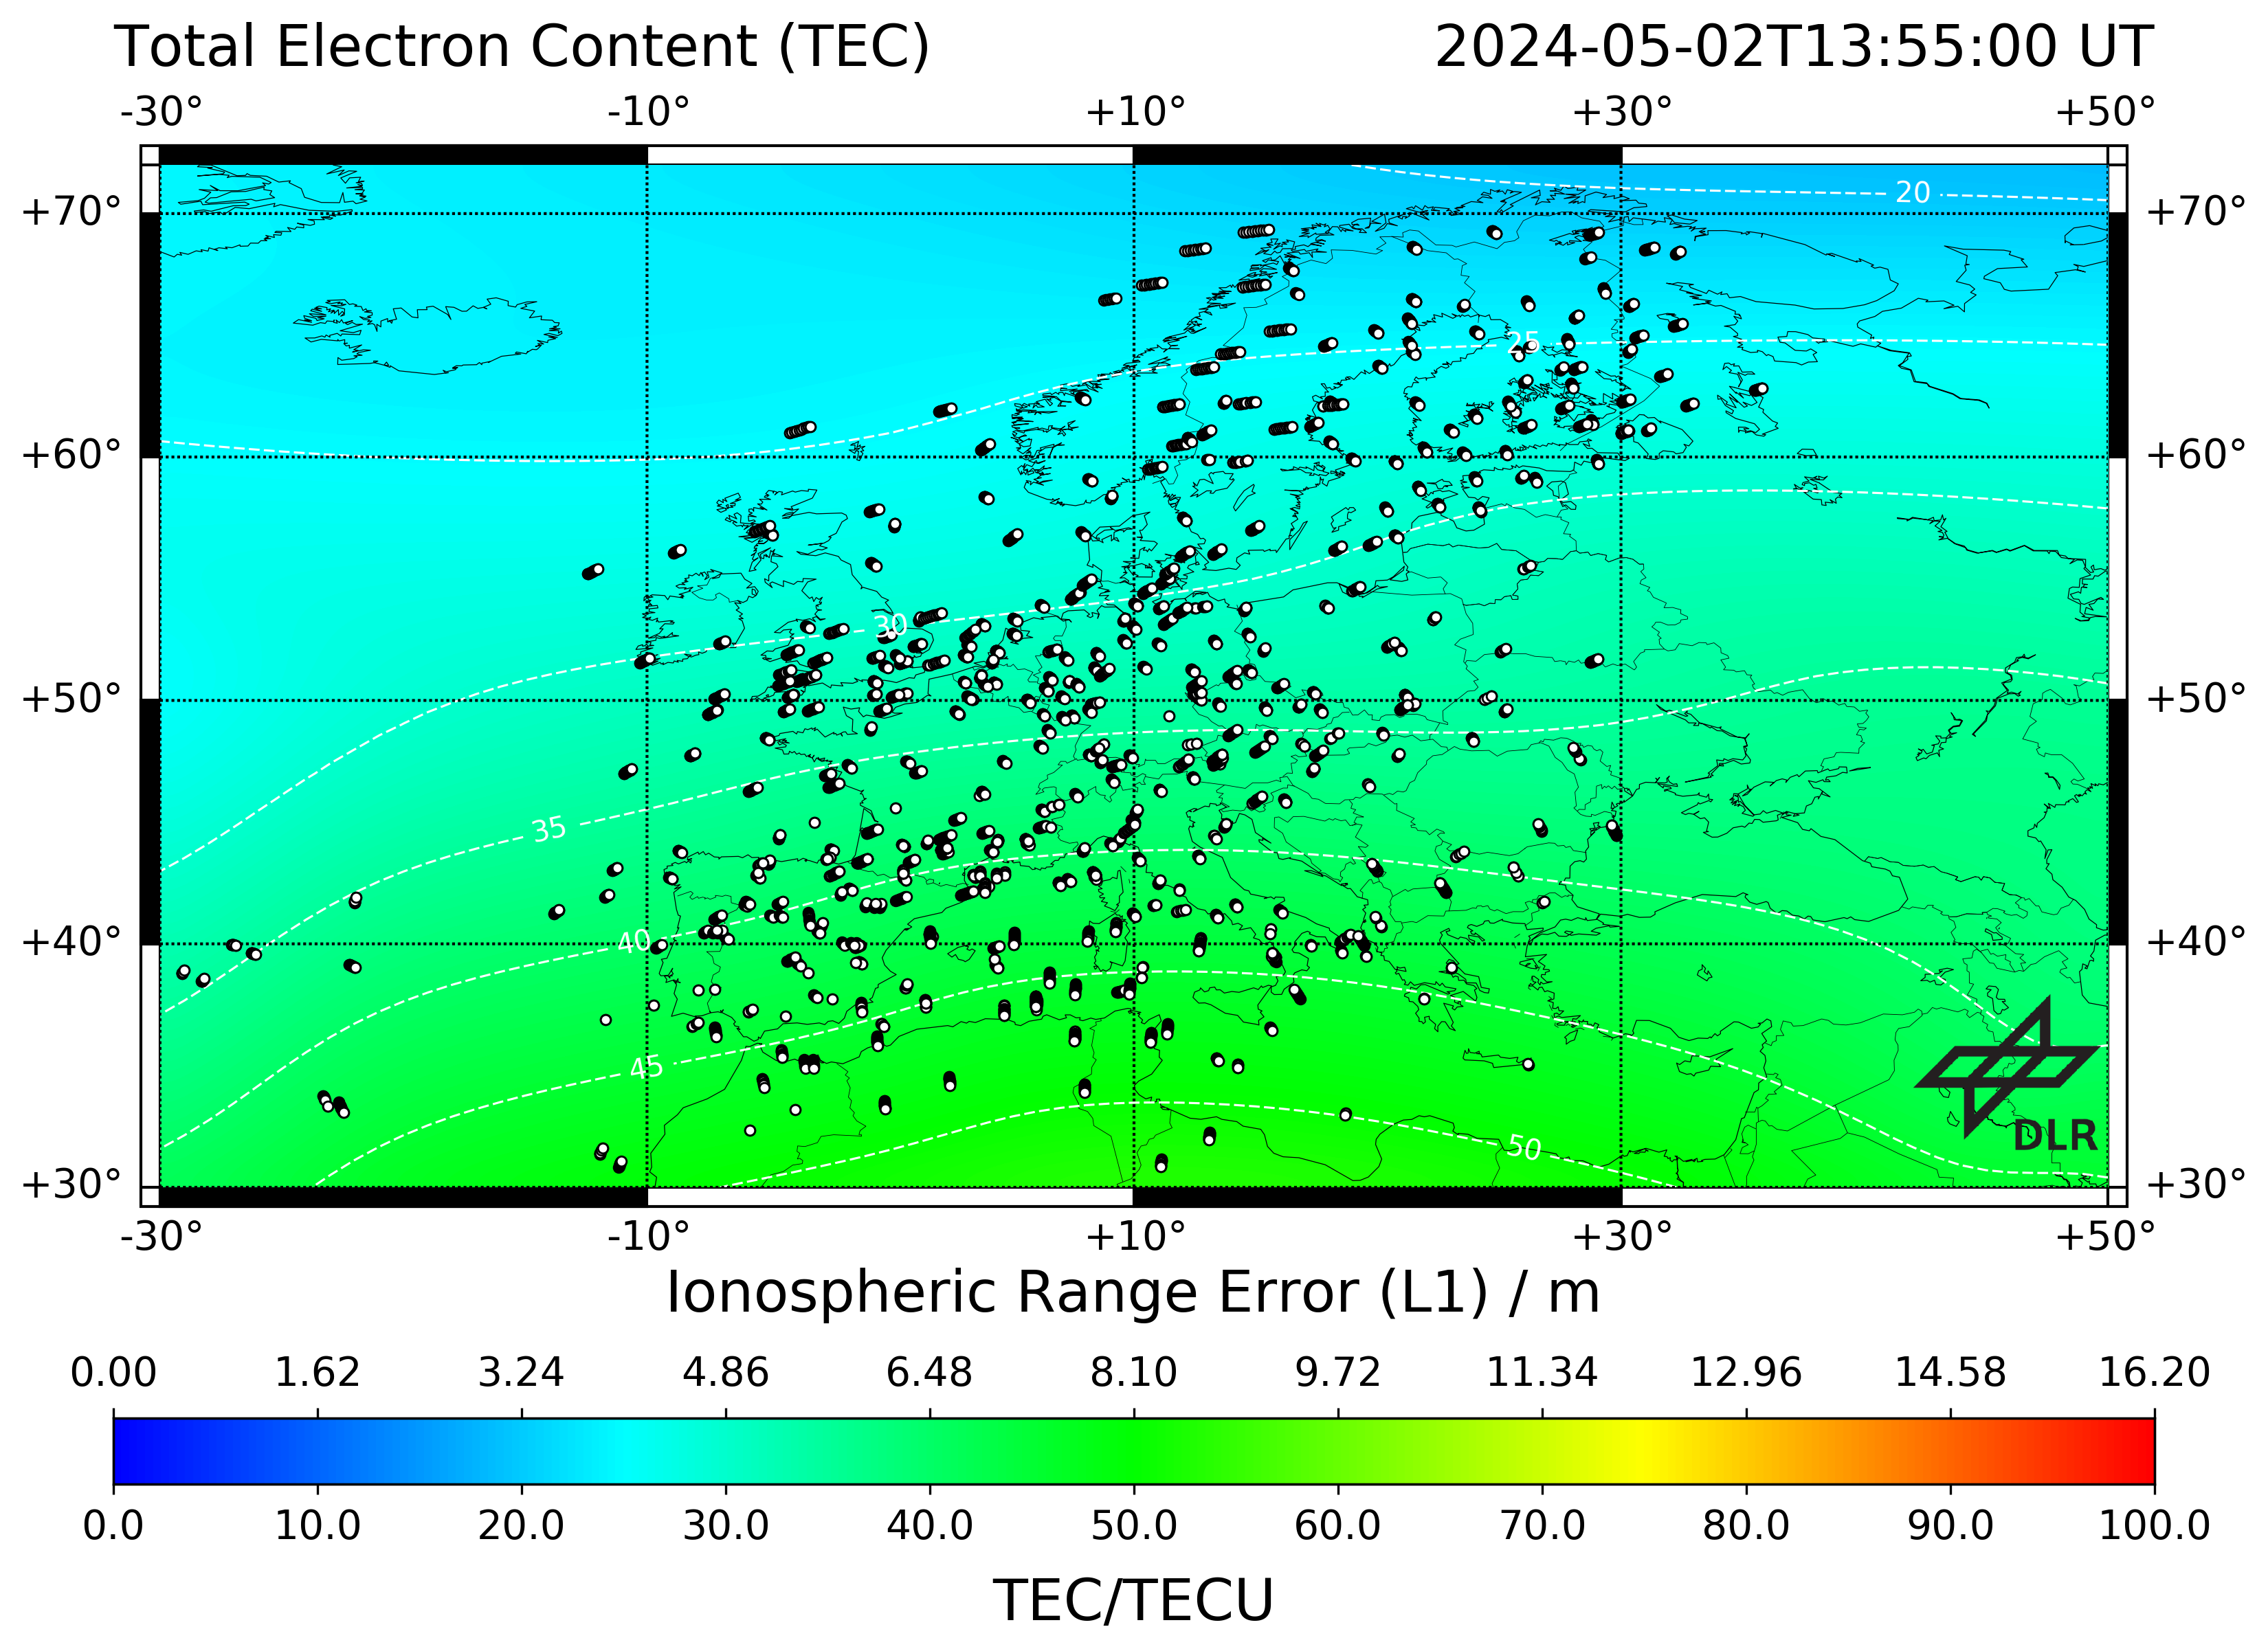
This TEC map is generated from ground based GNSS measurements assimilated into an empirical TEC model. GPS dual-frequency data is acquired as input from different providers in real-time, e.g. via the German Federal Agency for Cartography and Geodesy in Frankfurt. This data is preprocessed in order to derive calibrated slant TEC (STEC) and to update the coefficients of the Neustrelitz Total Electron Content Model (NTCM) serving as ionospheric background. Subsequently the calibrated STEC measurements are assimilated into NTCM (cf. Jakowski et al., 2011). The TEC is provided in TEC units (10^16 electrons per square meter) for a shell-height of 400 km.
Every 5 minutes a VTEC matrix with an ionospheric grid point spacing of 2° latitude x 2° longitude is generated and stored in ASCII format. Data is provided here with 15 minutes updated rate. Higher temporal resolution can be provided on request.
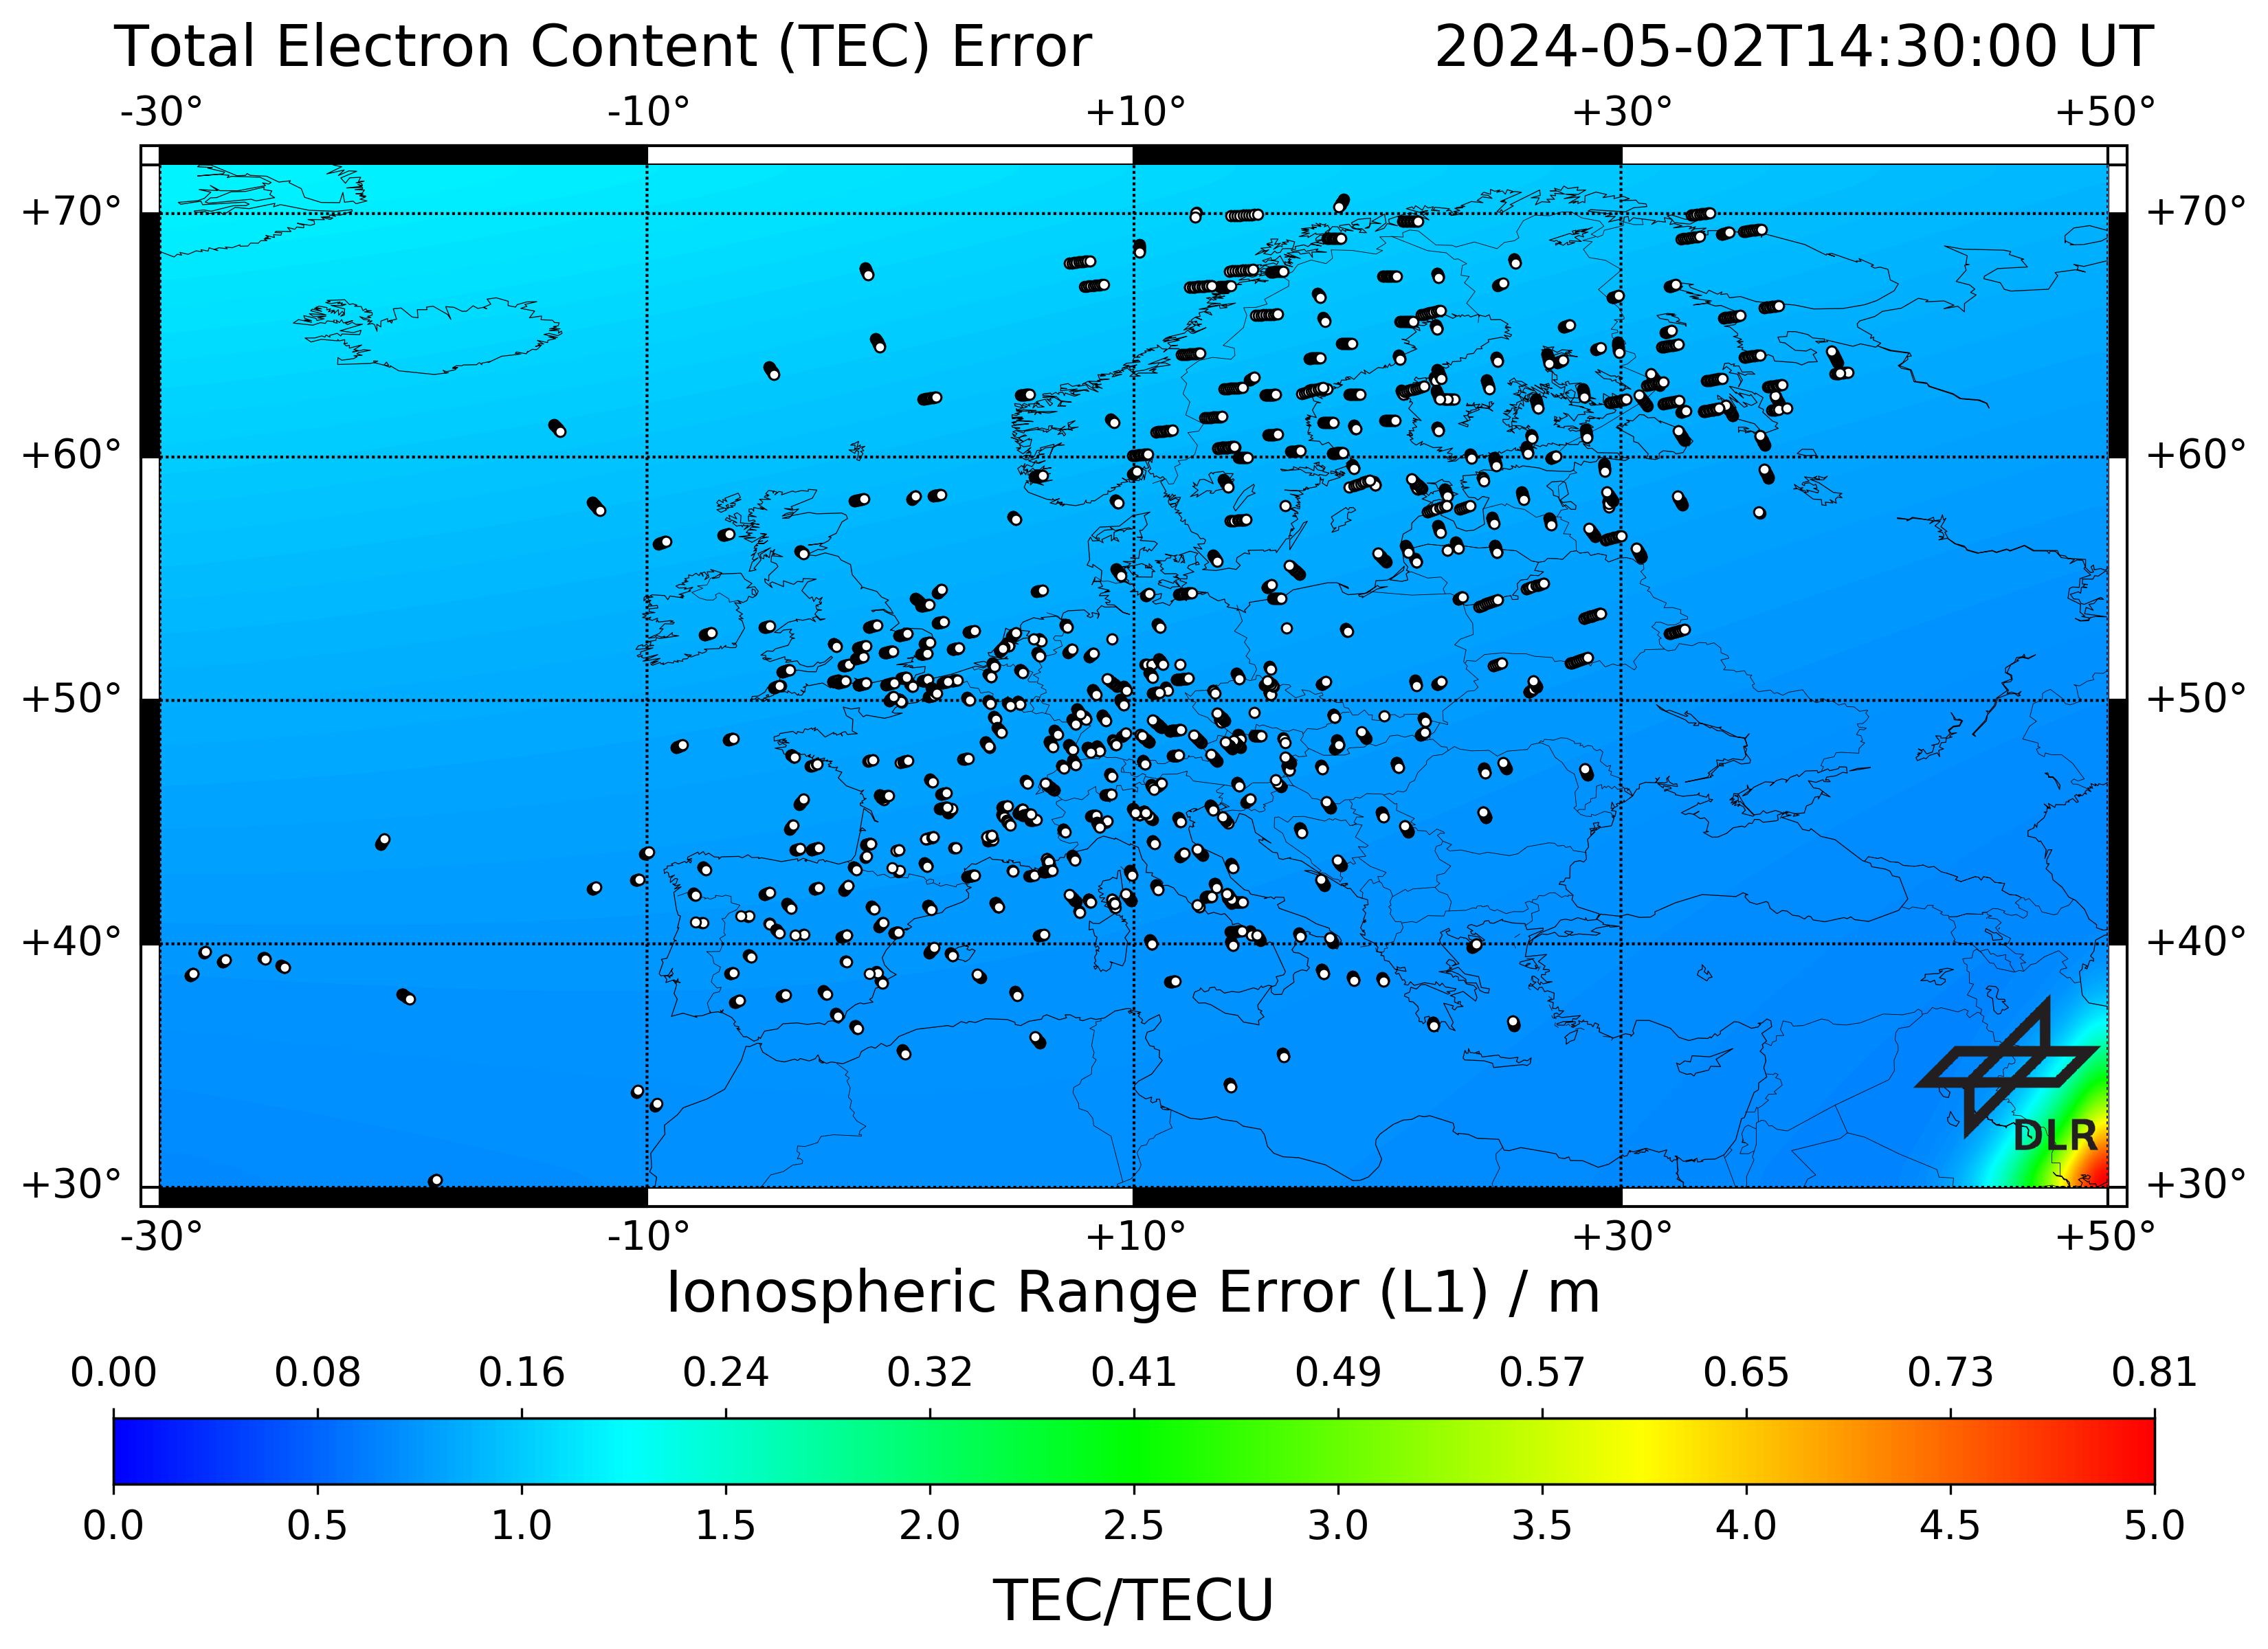
This product can be applied to help to improve the accuracy during GNSS positioning. Related validations can be found for instance in Minkwitz et al. (2014). The quality of the TEC map depends on the errors of the GNSS measurements. These errors are monitored through the production pipeline and displayed in a TEC error map. This TEC error map is provided as quality information along with the product.
Product Specification
| Specification | Description |
|---|---|
| External parties | German Federal Agency for Cartography and Geodesy, data providers below |
| Data providers | EUREF, ASI |
| Input data | GPS dual-frequency measurements |
| Input sampling rates | 1 s |
| Reliability of data source | Data is preprocessed by DLR including e.g. cycle slip detection |
| Region of sensors | Global - Used stations for TEC map generation are listed in the |
| Sensors | cf. station list |
| Single layer shell height | 400 km |
| Spatial resolution | 2° Latitude x 2° Longitude |
| Boundaries of grid | 30°N – 72°N, 30°W – 50°E |
| Temporal resolution | 15 min |
| Time information | UTC Time |
| Reference coordinate system | ECEF coordinate system with WGS84 reference ellipsoid |
| Algorithms | 24 hours weighted least-squares estimate of DCBs, background model coefficients; 5 min updates of DCBs and background model coefficients in linear recursive filter; previous estimates serve as background for the assimilation of estimated calibrated STEC into the update background model by means of a successive correction method, cf. Jakowski et al., 2011. |
| File format | ASCII |
ASCII file format | Header line containing: unit of TEC values, UTC time, minimum latitude in degree, maximum latitude in degree, minimum longitude in degree, maximum longitude in degree, latitude step width in degree, longitude step width in degree, size of data matrix Data matrix with VTEC values in TECU (1e+16 electrons/m²): Upper left corner value represents the minimum longitude and maximum latitude; the lower right corner value represents the maximum longitude and minimum latitude value |
Error of the NRT TEC map for Europe, derived from errors of the GNSS measurements. The given errors are related to the uncertainty of the in real-time derived TEC values from GNSS measurements and the error propagation based on the modelling and assimilation processes. The error/uncertainty is low in regions where a high density of real time measurements is available and higher in regions without measurements, where the TEC values are calculated via the TEC-model only (e.g. over oceans and in mountain regions).