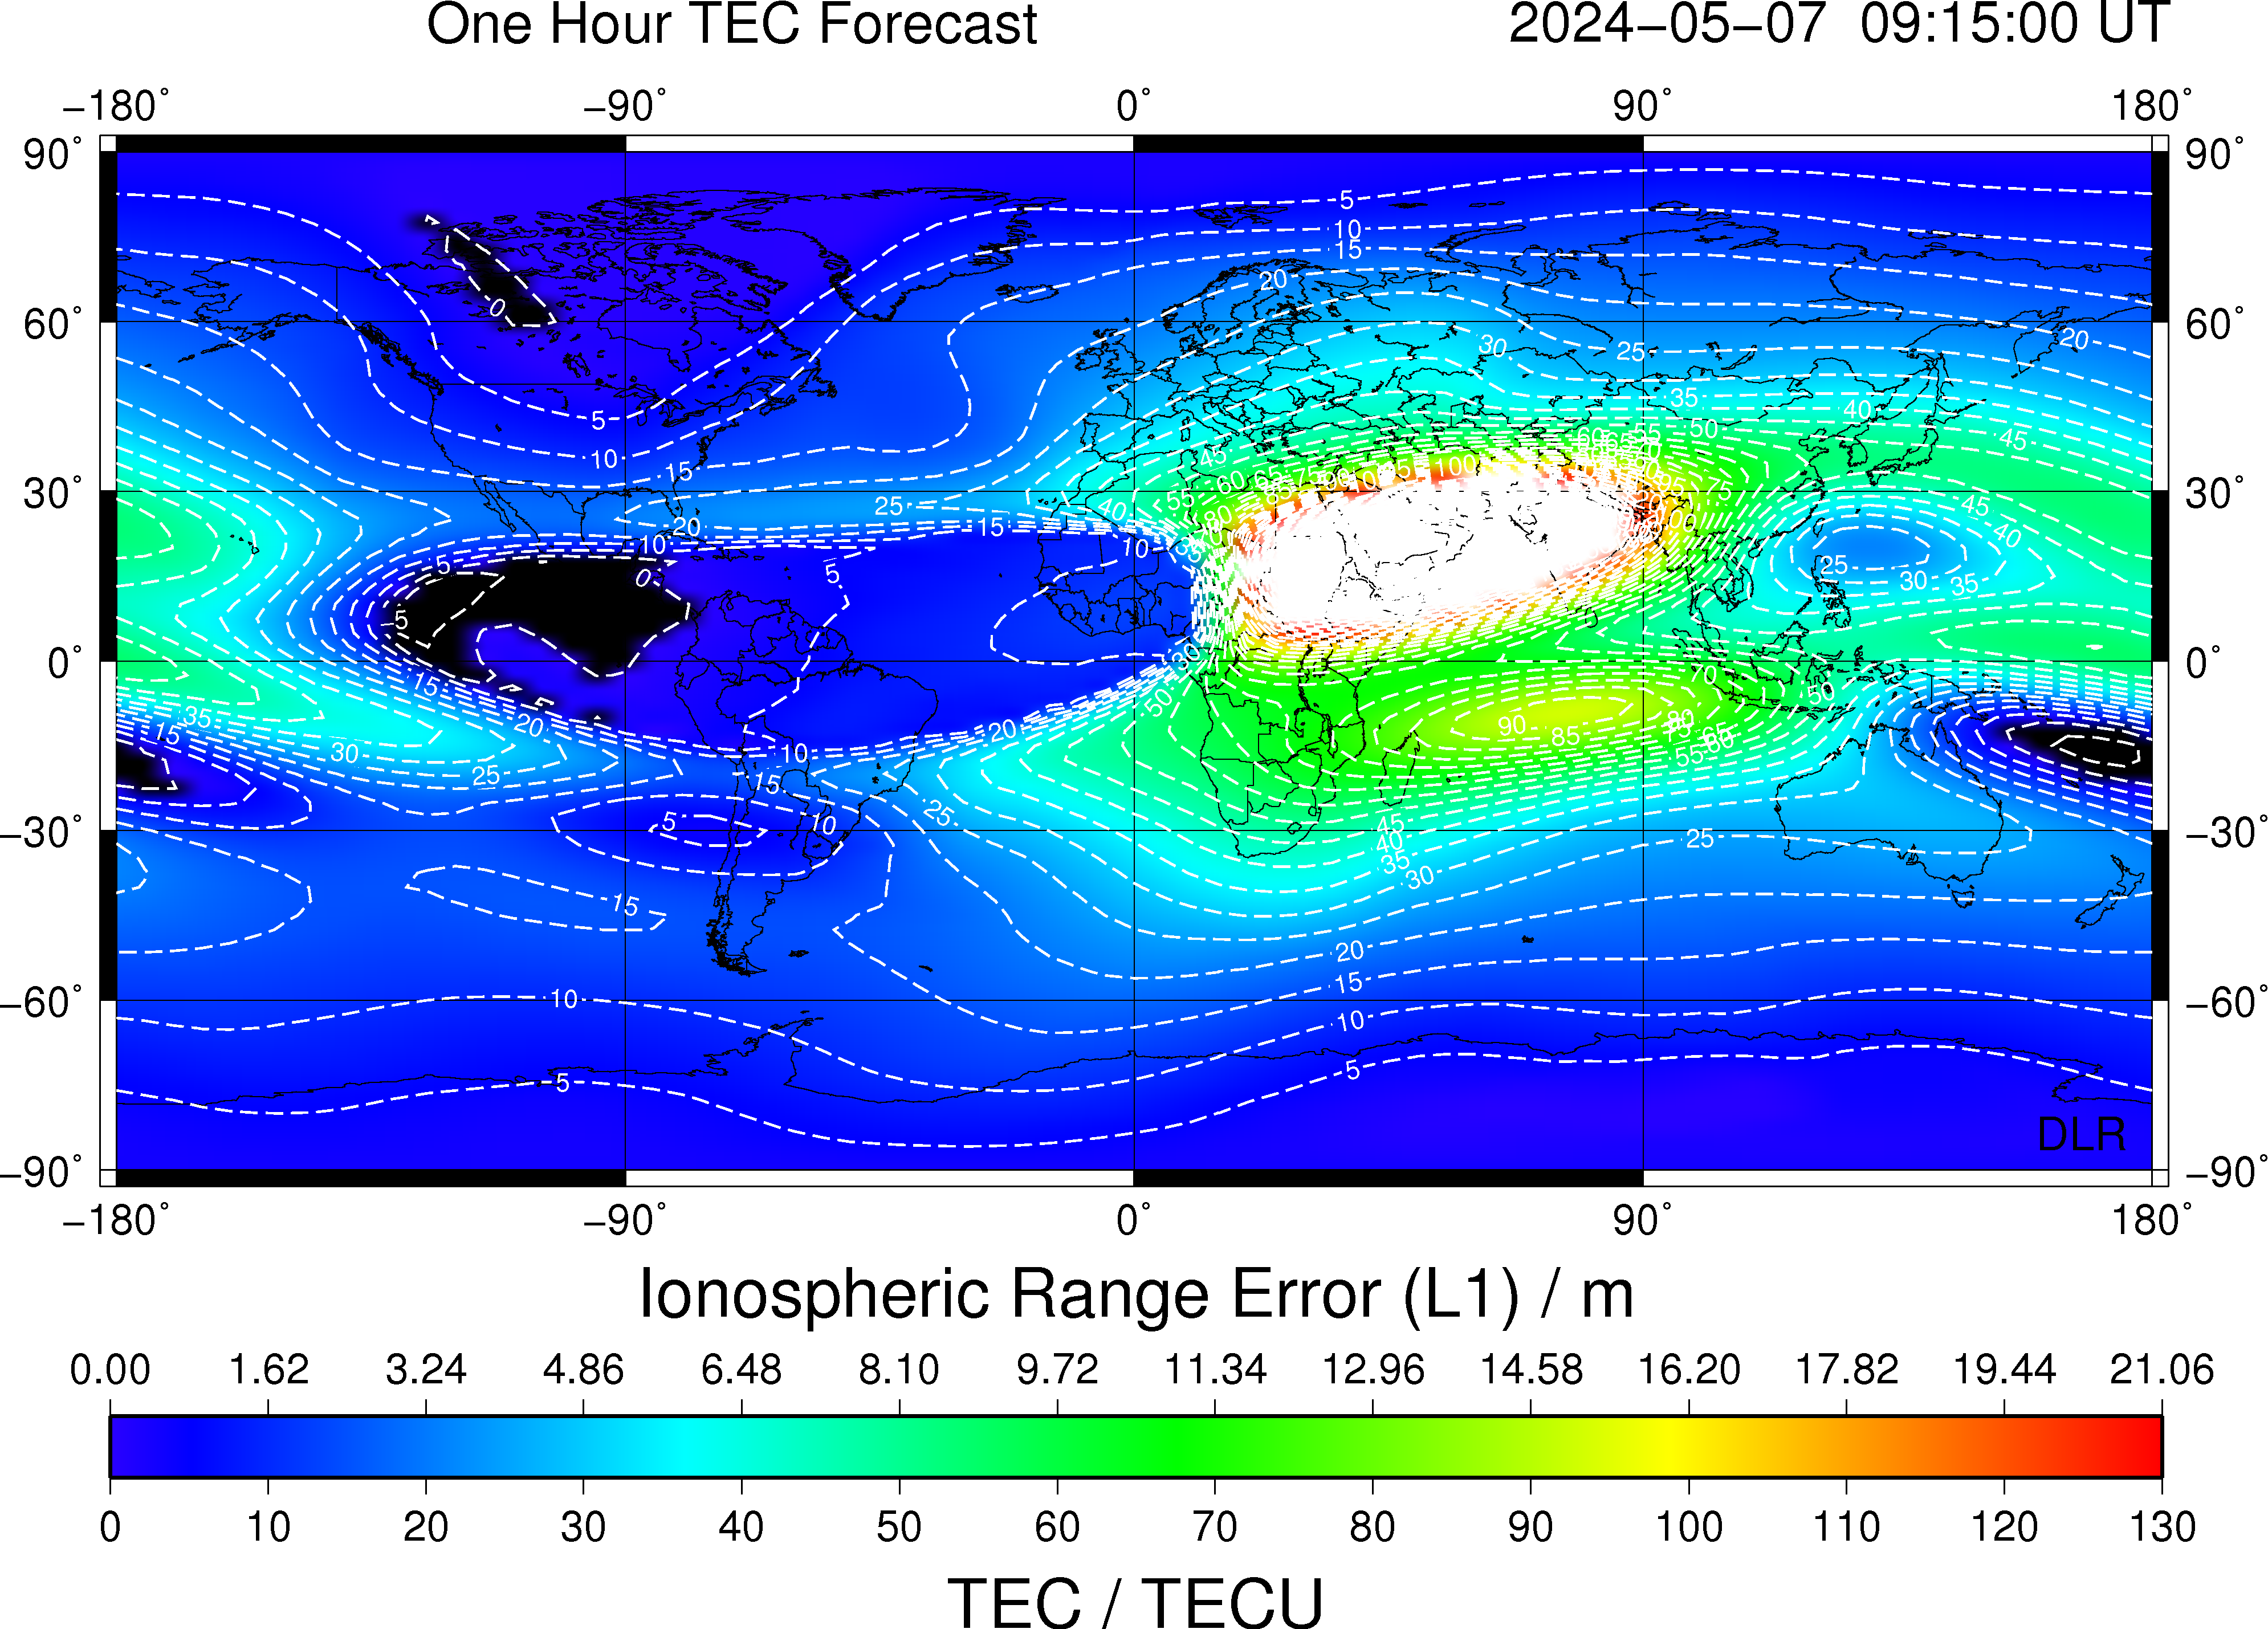
One hour Forecast TEC Map, Global
Latest Data
Latest Data
Product Description
Product Description
DLR's global total electron content (TEC) forecast maps provide information about an one hour vertical TEC (VTEC) forecast at a shell-height of 400 km at global scale. The one hour forecast is calculated as a sum of the actual global TEC maps and a weighted sum of temporal TEC gradient of the previous hour and the temporal gradient of the previous day at the same time. Consequently the forecast maps are based on GPS data acquired from different providers in real-time via the German Federal Agency for Cartography and Geodesy in Frankfurt. The one hour forecast is provided every 15 min as a VTEC matrix with an ionospheric grid point spacing of 2.5° latitude x 5° longitude in ASCII format.
Product Specification
| Specification | Description |
|---|---|
| External parties | German Federal Agency for Cartography and Geodesy, data providers below |
| Data providers | IGS, Greenland network of the Technical University of Denmark |
| Input data | GPS dual-frequency measurements |
| Input sampling rates | 1 s |
| Reliability of data source | Data is preprocessed by DLR including e.g. cycle slip detection |
| Region of sensors | Global |
| Sensors | cf. station list |
| Single layer shell height | 400 km |
| Spatial resolution | 2.5° Latitude x 5° Longitude |
| Boundaries of grid | 90°S - 90°N, 180°W - 180°E |
| Temporal resolution | 15 min |
| Time information | UTC Time |
| Reference coordinate system | ECEF coordinate system with WGS84 reference ellipsoid |
| Algorithms | The one hour forecast is calculated as a sum of the actual global TEC map and a weighted sum of the temporal TEC gradient of the previous hour and the temporal gradient of the previous day at the same time. |
| File Format | ASCII |
| ASCII file format |
Header line containing: unit of TEC values, UTC time, minimum latitude in degree, maximum latitude in degree, minimum longitude in degree, maximum longitude in degree, latitude step width in degree, longitude step width in degree, size of data matrix. Data matrix with VTEC values in TECU (1e+16 electrons/m²): Upper left corner value represents the minimum longitude and maximum latitude; the lower right corner value represents the maximum longitude and minimum latitude value |
Quality Information
Quality Information
- Error of the Forecast TEC map for Europe provided one hour ago. It is derived from deviations to NRT TEC maps.

Archive
| Name | Last modified | Size | Description | |
|---|---|---|---|---|
| Parent Directory | - | |||
| 2023/ | 2025-01-01 04:04 | - | ||
| 2024/ | 2025-04-26 04:00 | - | ||
| latest/ | 2024-07-03 12:16 | - |
