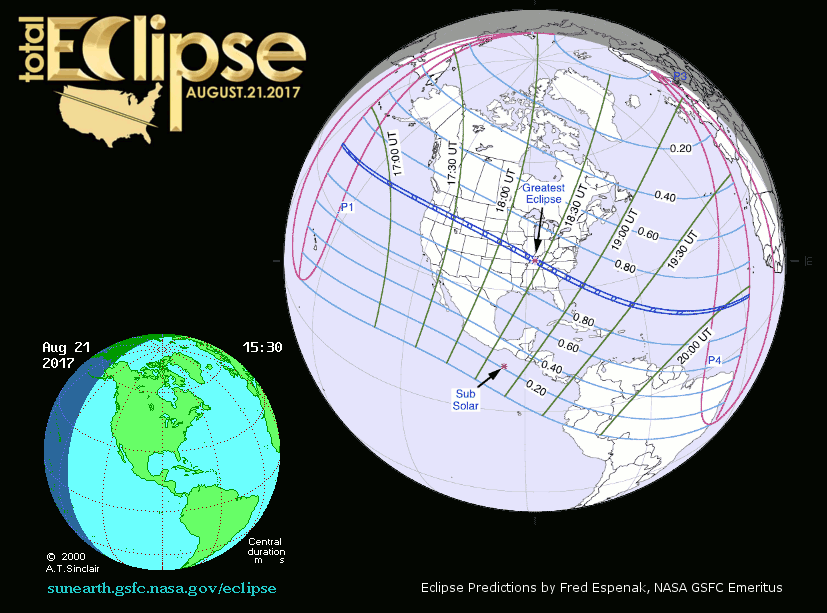
NASA created a special website to provide a guide to this amazing event (<link (https://eclipse2017.nasa.gov/).>https://eclipse2017.nasa.gov/</link>). The solar eclipse path over North America on 21 August 2017 is seen in Fig. 1 and more detailed on NASA's webpage. As Fig. 1 shows, the eclipse occurs between 16:50 and about 20:00 UT, starting over the Pacific then moving towards Northwest America then crossing US towards Southeast. Outside the totality zone the shadow of the eclipse will be visible in varying degrees all over North America. Considering the obscuration function of the sun during the eclipse, the solar irradiation will be switched off and on in a well-defined manner.
GPS measurements
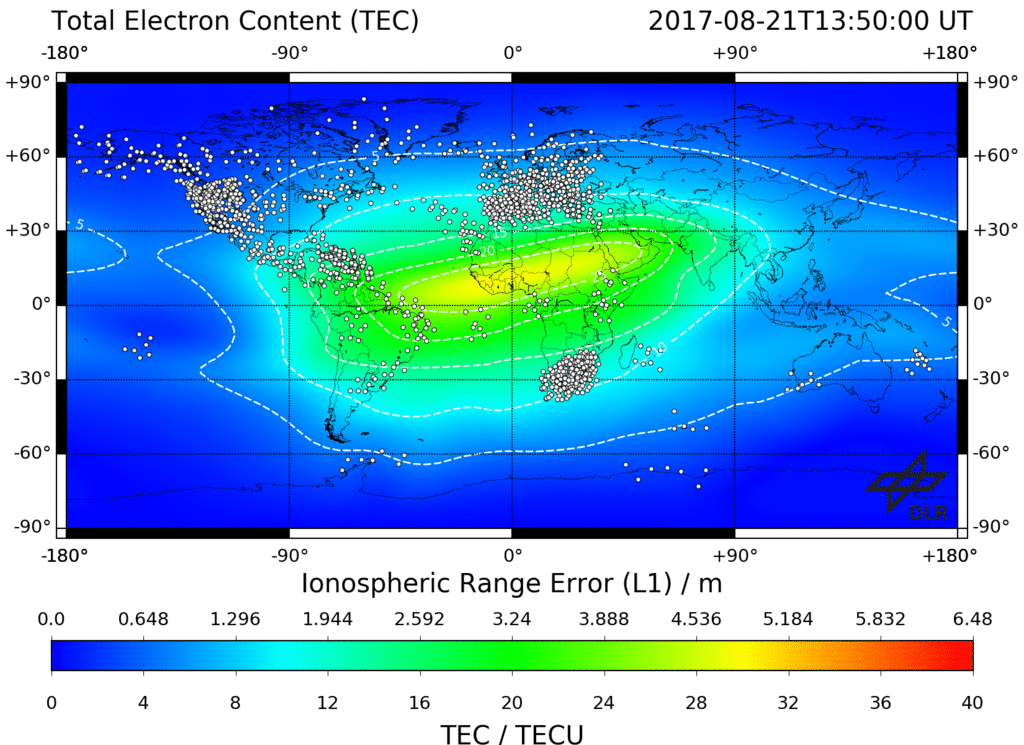
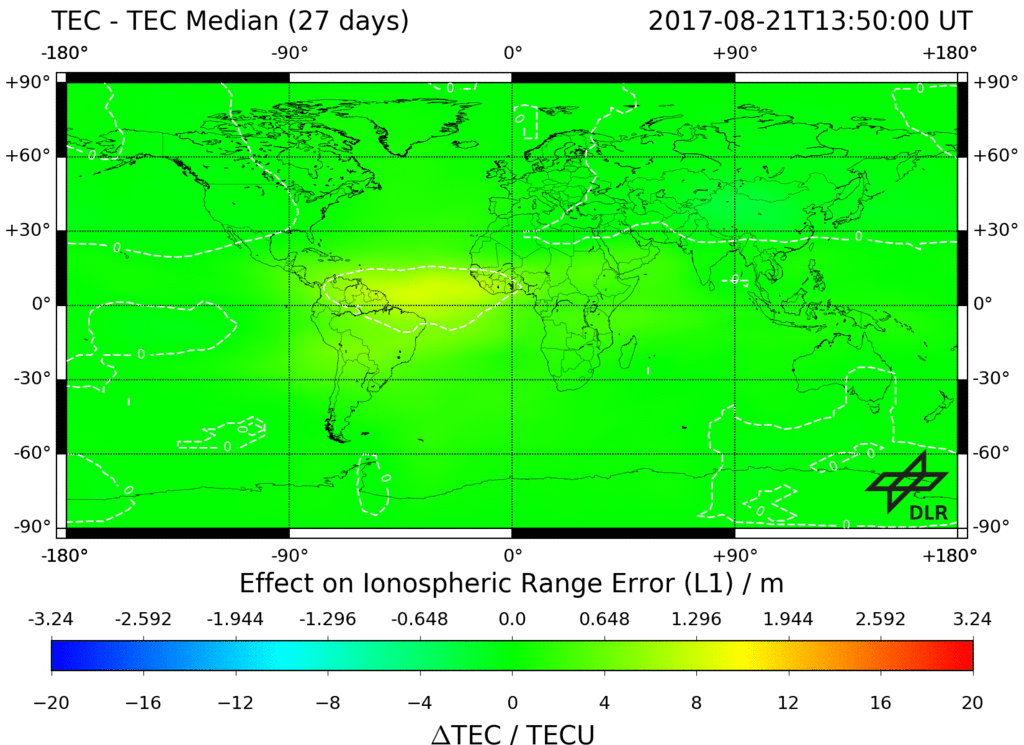
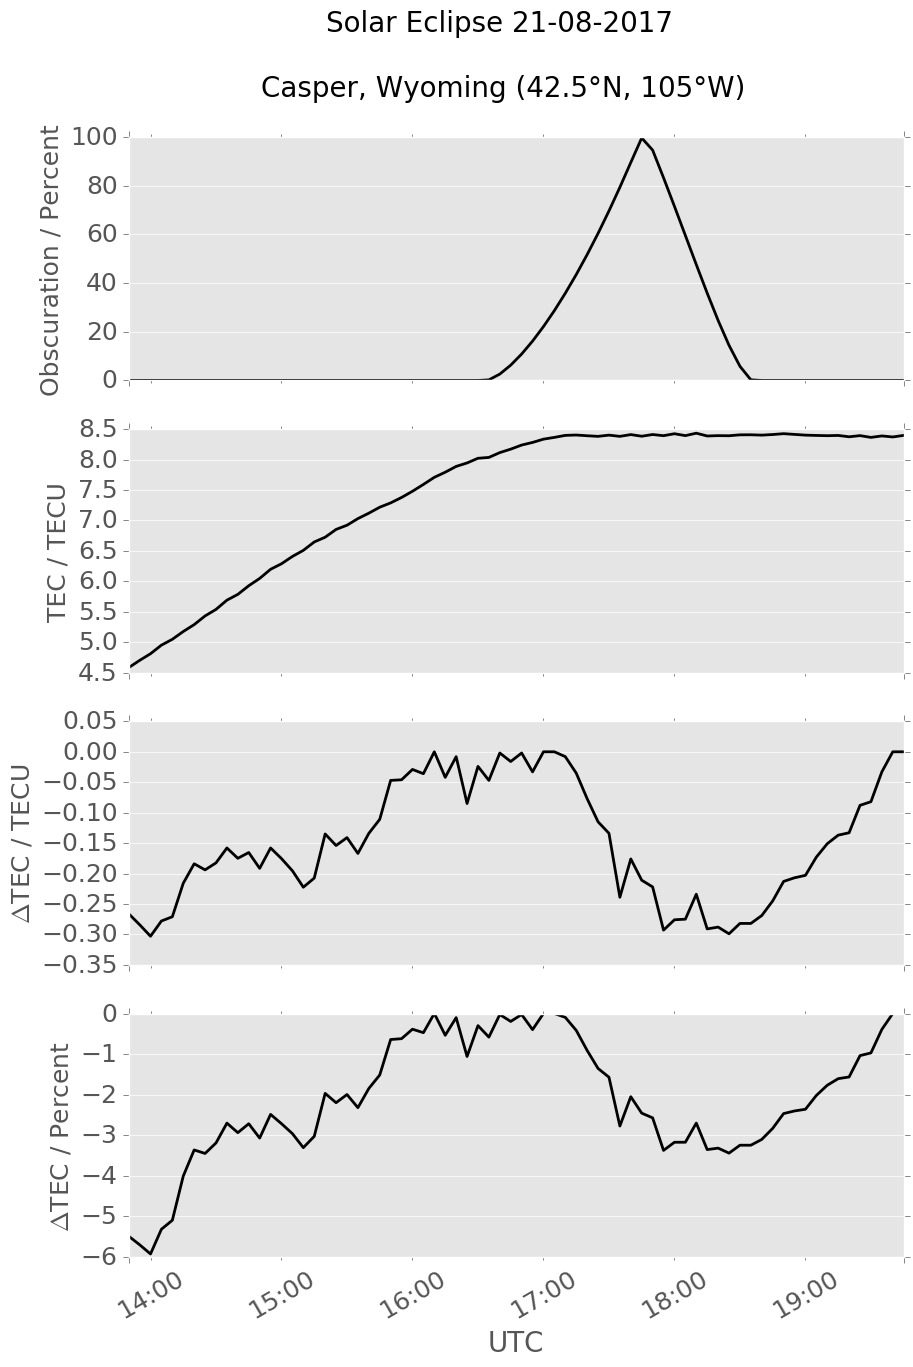
Due to the close coupling of the solar illumination with photoionization processes in the Earth’s atmosphere the ionization level follows the obscuration function principally but with a certain delay ([1–5]). We are able to show the behavior of the global total ionospheric ionization by monitoring of the total electron content (TEC) of the ionosphere via the Ionospheric Monitoring and Prediction Center (IMPC) of DLR (<link impc.dlr.de _blank external-link-new-window "Opens external link in new window">http://impc.dlr.de/</link>) in near real time (delay 5 min).The DLR service uses 1 Hz streaming mode GPS measurements provided by various GNSS data networks such as the <link www.igs.org _blank external-link-new-window "Opens external link in new window">International GNSS Service (IGS)</link>,<link epncb.oma.be _blank external-link-new-window "Opens external link in new window">EUREF</link>,<link geodaf.mt.asi.it/index.html _blank external-link-new-window "Opens external link in new window">ASI</link>,<link www.trignet.co.za _blank external-link-new-window "Opens external link in new window">TrigNet</link> and <link www.unavco.org/data/gps-gnss/gps-gnss.html _blank external-link-new-window "Opens external link in new window">UNAVCO</link> distributed via several NTRIP Casters including the services of <link www.bkg.bund.de/DE/Home/homepage__node.html__nnn=true _blank - "Opens external link in new window">BKG</link> Frankfurt. Here we present the actual global TEC map (see Fig. 2) and the related differential TEC map (see Fig. 3) obtained by subtracting 27 days median from the actual TEC map values on 21 August 2017. Both animations enable the visitor to see the reduction of ionisation due to the solar eclipse in comparison with the occultation function (see Fig. 4). From the scientific point of view thesolar eclipse can be considered as an active experiment with a well-defined variation of the solar illumination as discussed in earlier publications [2-5]. The dependencyofthe locally observed TEC from thesolar illuminationcan be observed by monitoring TEC and deviation from the mediansinside the totality zonein relation to the local obscuration functionas shown in Fig. 4.
VLF propagation
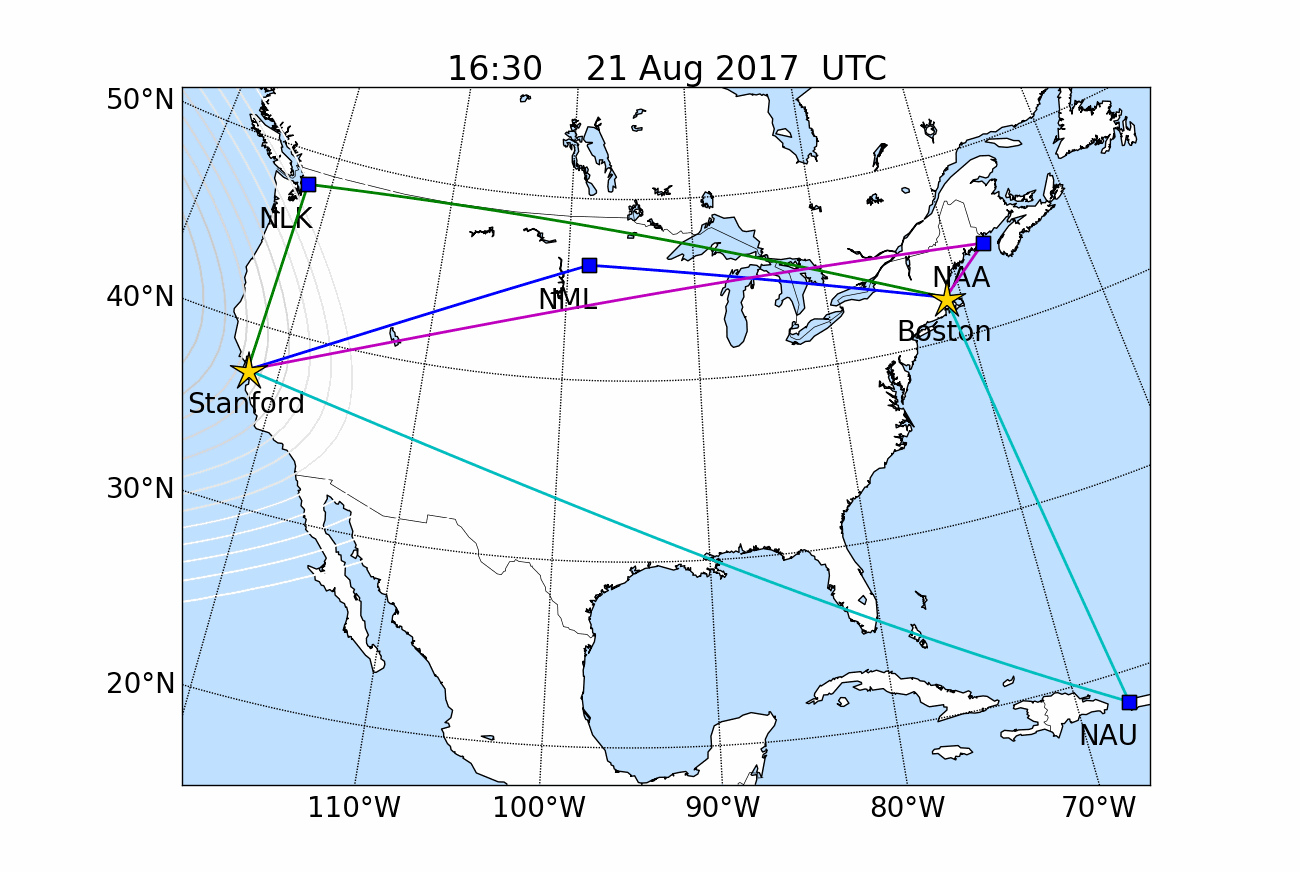
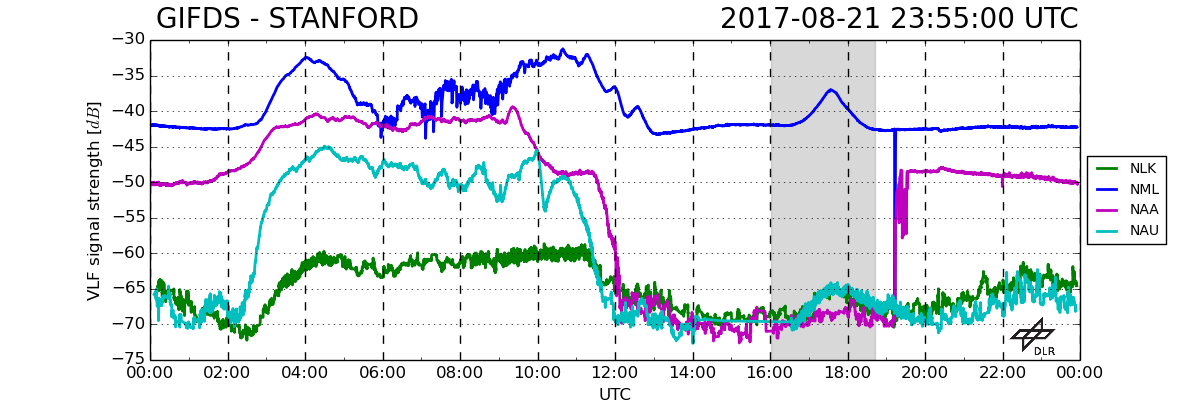
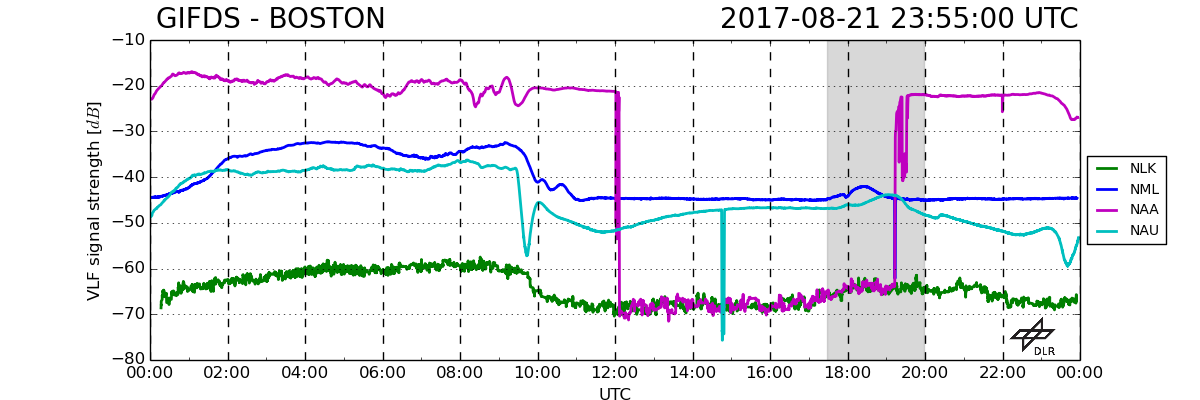
Since the eclipse impacts ionization of all ionospheric layers it is expected that also the bottomside ionosphere changes rapidly with the eclipse. Accompanied VLF propagation measurements indicate some changes of signal strength and phase during the eclipse event. DLR just establishes a Global Ionosphere Flare Detection System (GIFDS) that will be ready this year [5, 7]. TwoGIFDS receiving sites are situated in the area of partial obscuration, one hosted by the <link gps.stanford.edu _blank external-link-new-window "Opens external link in new window">WAAS Lab at the Stanford University</link> and one by the <link www.bc.edu/research/isr.html _blank external-link-new-window "Opens external link in new window">Institute for Scientific Research at the Boston College</link> (see Fig. 5). The following two figures show the VLF signal strength of various transmitters received by GIFDS. The data has a resolution of 1Hz and an update rate of 5 minutes.
Acknowledgement
We extend our sincere thanks to all the people behind the NTRIP data services of ASI, BKG, EUREF, IGS, TrigNet and UNAVCO for providing us high rate GNSS data in real time and the NTRIP caster software. We also highly appreciate the support from the <link gps.stanford.edu _blank external-link-new-window "Opens external link in new window">WAAS Lab at the Stanford University</link> and the <link www.bc.edu/research/isr.html _blank external-link-new-window "Opens external link in new window">Institute for Scientific Research at the Boston College</link> for hosting and maintaining both GIFDS stations. Finally, we like to thank the scientific community and our followers which are highly interested in our work and results and motivate us to improveour products and services.
References
[1] N. Jakowski, H.D. Bettac, B. Lazo, L. Palacio, L. Lois, The ionospheric response to the solar eclipse of 26 February 1979 observed in Havana/Cuba, Phys.Solariterr., No.20, 110-116, 1983
[2] N. Jakowski, S. Schlueter, S. Heise, J. Feltens, 1999.Satellite Technology Glimpses Ionospheric Response to Solar Eclipse, EOS, Transactions. American Geophysical Union, 80, 51, 21 December 1999.
[3] N. Jakowski, S. Heise, A. Wehrenpfennig, S. Schlueter, 2001.Total electron content studies of the solar eclipse on 11 August 1999, CD-ROM, Proc. IBSS, Boston, 4-6 June, 2001, 279-283
[4] N. Jakowski, S. M. Stankov, V. Wilken, C. Borries, D. Altadill, J. Chum, D. Buresova , J. Boska, P. Sauli, H. Hruska, L. Cander, Ionospheric behaviour over Europe during the solar eclipse of 3 October 2005,J. Atmos. Sol. Terr. Phys., 70, 836–853, 2008
[5] M.M. Hoque, D. Wenzel, N. Jakowski, T. Gerzen, J. Berdermann, V. Wilken, M.Kriegel, H. Sato, C. Borries, and D. Minkwitz (2016) Ionospheric response over Europe during the solar eclipse of March 20, 2015, J. Space Weather Space Clim. , 6, A36
[6] N. Jakowski, C. Mayer, M. M. Hoque, and V. Wilken (2011), TEC Models And Their Use In Ionosphere Monitoring, Radio Sci., 46, RS0D18, doi:10.1029/2010RS004620, 2011
[7] D. Wenzel, N. Jakowski, J. Berdermann, C. Mayer, C. Valladares, B. Heber, "Global Ionospheric Flare Detection System (GIFDS), JASTP, vol. 138-139, 233-242, <link dx.doi.org/10.1016/j.jastp.2015.12.011 _blank>http://dx.doi.org/10.1016/j.jastp.2015.12.011</link>
US TEC data material is based on UNAVCO GPS data stream services provided by the UNAVCO Facility with support from the National Science Foundation (NSF) and National Aeronautics and Space Administration (NASA) under NSF Cooperative Agreement No. EAR-0735156.