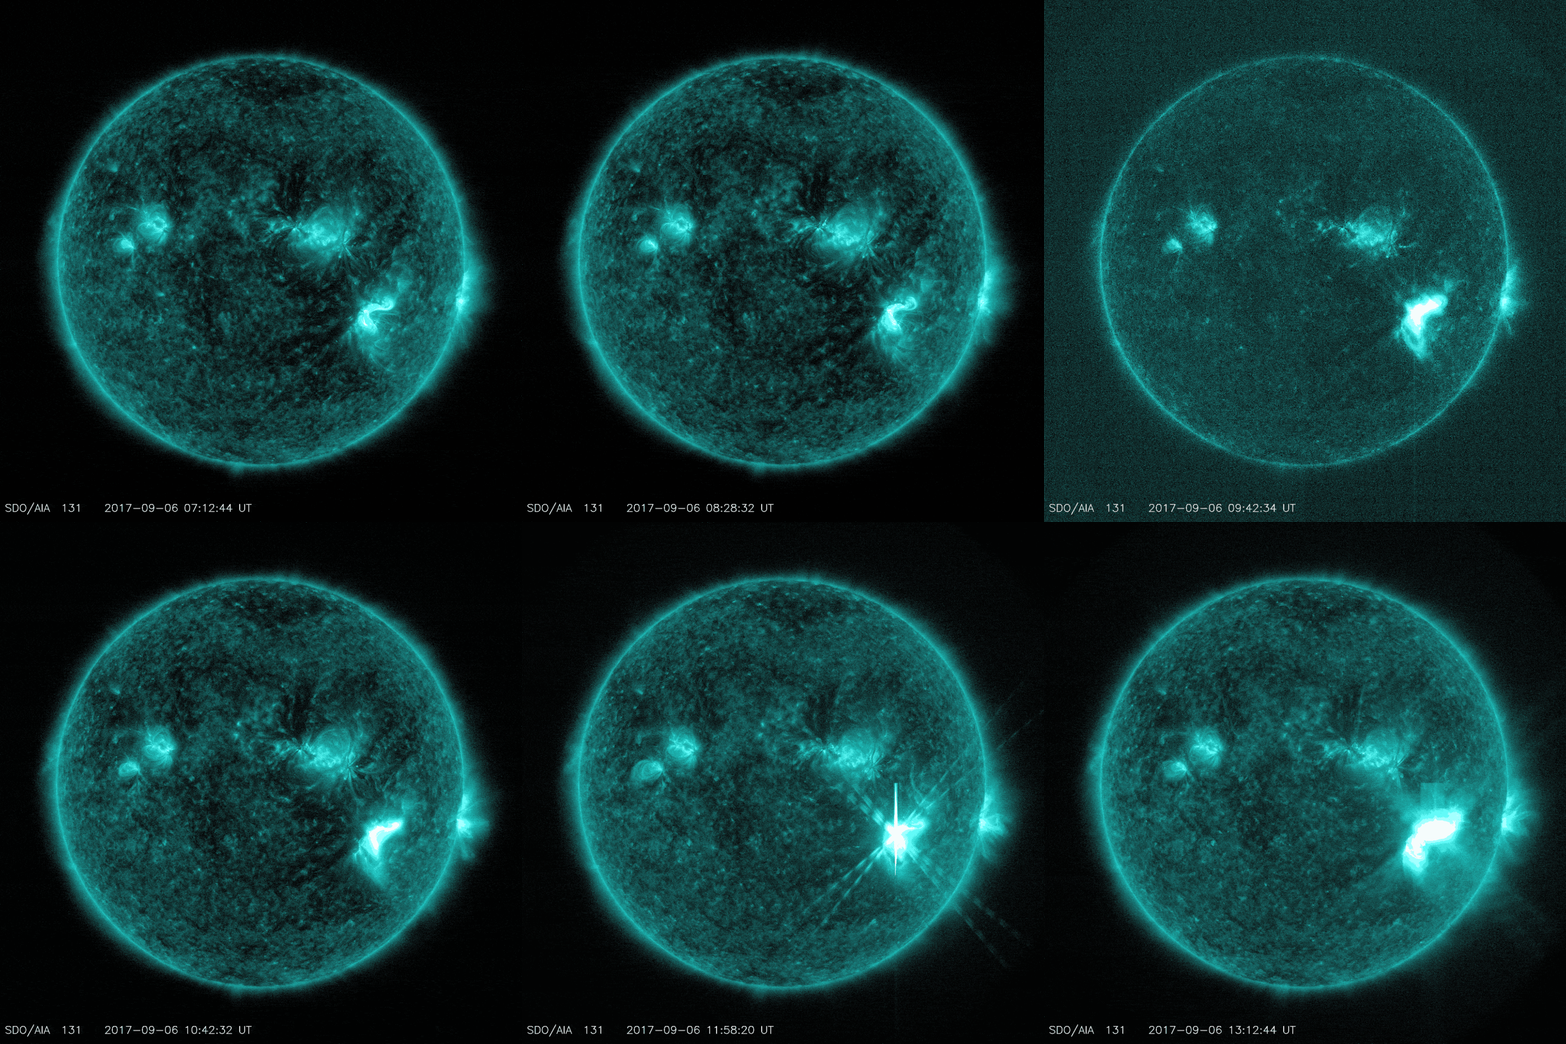
Threats for communication and navigation systems (e.g. GNSS applications and HF communication) often originate in ionospheric disturbances. Accurately timed warnings can help essentially to mitigate them. The currently developed Ionospheric Warning System is a multi-level warning system with warnings ranging from long term predictions to real-time alerts. The warning messages can be found here. They are additionally distributed via Email to the user community. Interested users can subscribe to the eMail-service.
Detection by DLR's Global Ionospheric Flare Detection System (GIFDS)
The Global Ionospheric Flare Detection System (GIFDS) operated by the German Aerospace Center (DLR) is a network of ground based receivers for continuous monitoring of the solar flare activity. Since flares are radiation bursts covering nearly the whole electromagnetic spectrum, strong events interfere with HF radio communication and can even cause radio blackouts. By means of GIFDS, DLR is able to show the direct impact of flares on the lower ionosphere in real-time with an update rate of 1 Hz. Therefore, GIFDS is using Very Low Frequency radio transmissions which immediately respond to ionization changes caused by such X-ray flares. Five globally distributed GIFDS stations enable continuous monitoring of the dayside lower ionosphere and consequently solar flare activity. The receivers monitor the amplitude and phase of multiple frequency channels in the complete VLF/LF range.
Detection by DLR's ROTI monitoring
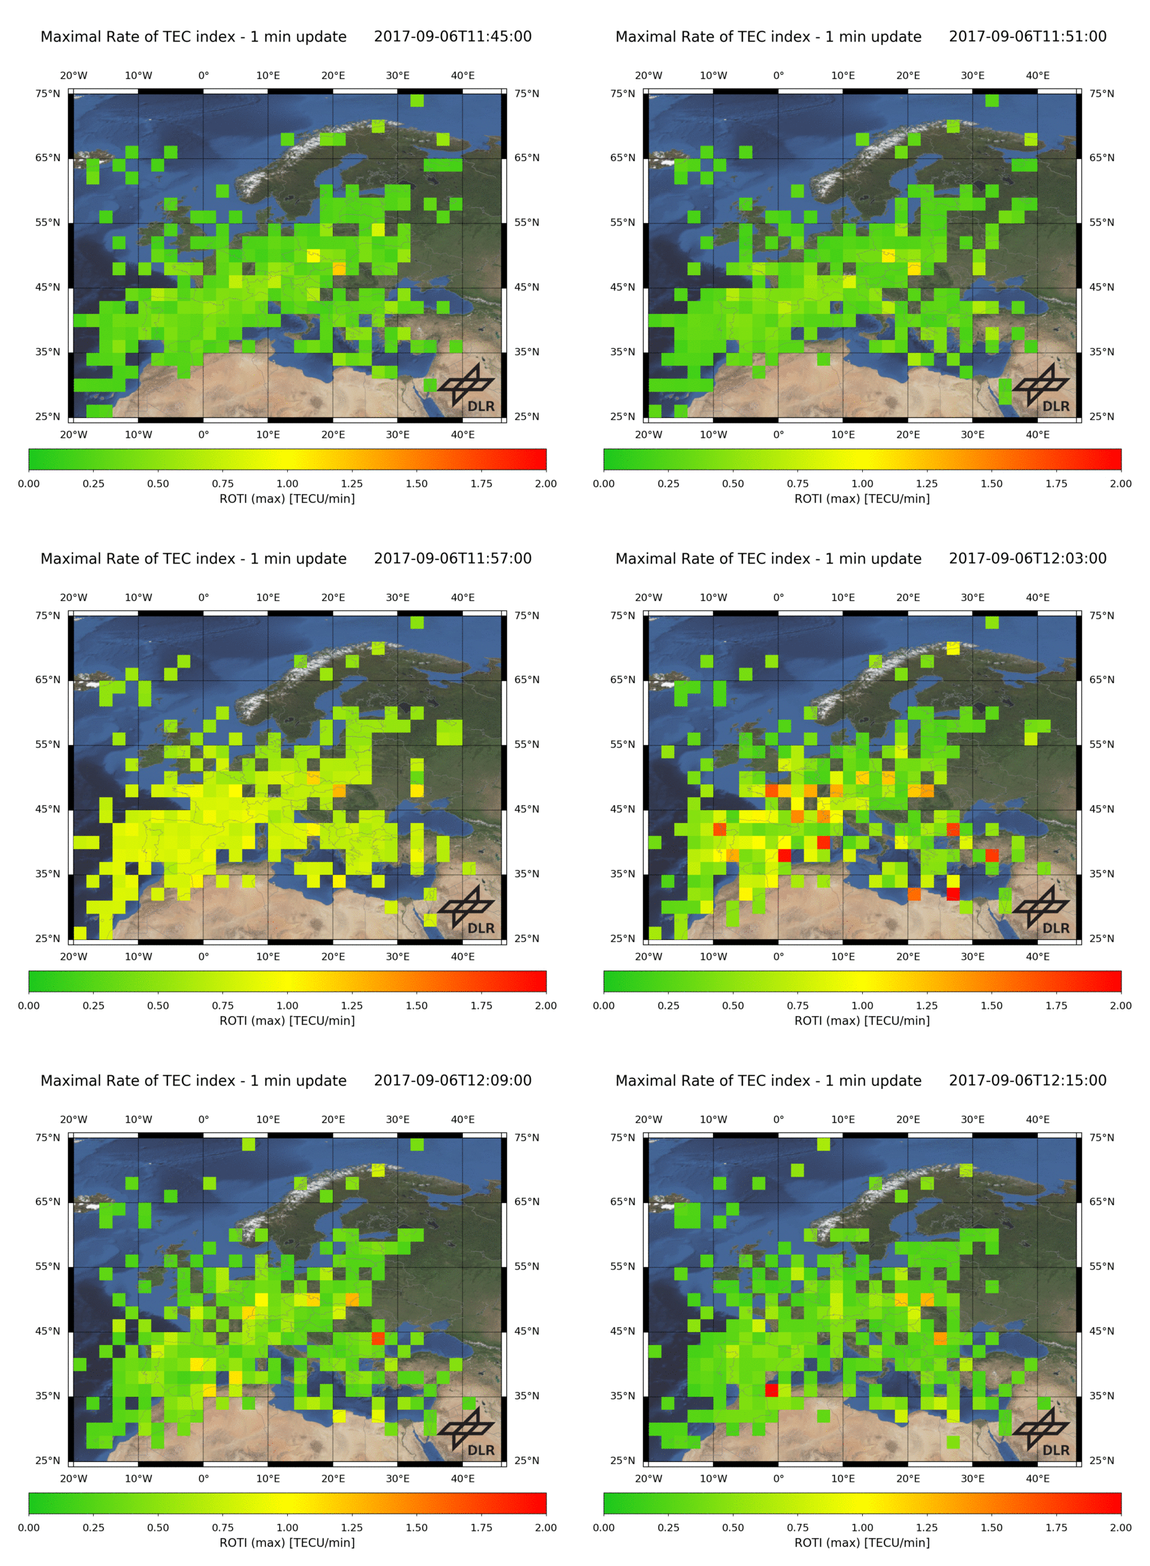
The Rate of TEC index (ROTI) is defined as standard deviation of the rate of TEC assuming the ionosphere as a thin layer. Hence the index provides information about temporal ionospheric irregularities. DLR's ROTI is calculated in real time for the European and global region. As input GPS dual-frequency data is acquired from different providers, like IGS and EUREF, in real-time via the German Federal Agency for Cartography and Geodesy in Frankfurt. These data is used to calculate relative TEC as input for the ROTI processing. The standard deviation is calculated over a one minute window and the ROT is calculated each second.
The ROTI measurements are mapped into a regular grid (2°x2° lat/lon). Each grid cell presents the mean or maximum value of the ROTI measurements located in this cell.
Acknowledgements
We like to thank the people behind ASI, DTU, EUREF, IGS, MGEX, SATREF, TrigNet and UNVACO for cooperation and for the provision of 1 Hz real time GNSS data!
Contact


