One hour Forecast TEC Map, Global
DLR’s 1 hour forecast global TEC maps provide information about the vertical TEC (VTEC) one hour ahead with a latency of not more than 5 minutes and an update rate of 15 minutes. The maps have a global coverage with 2.5° in latitudes and 5° in longitude spatial resolution. The one hour forecast is calculated as a sum of the actual global TEC map and a weighted sum of the temporal TEC gradient of the previous hour and the temporal gradient of the previous day at the same time.
Latest Data
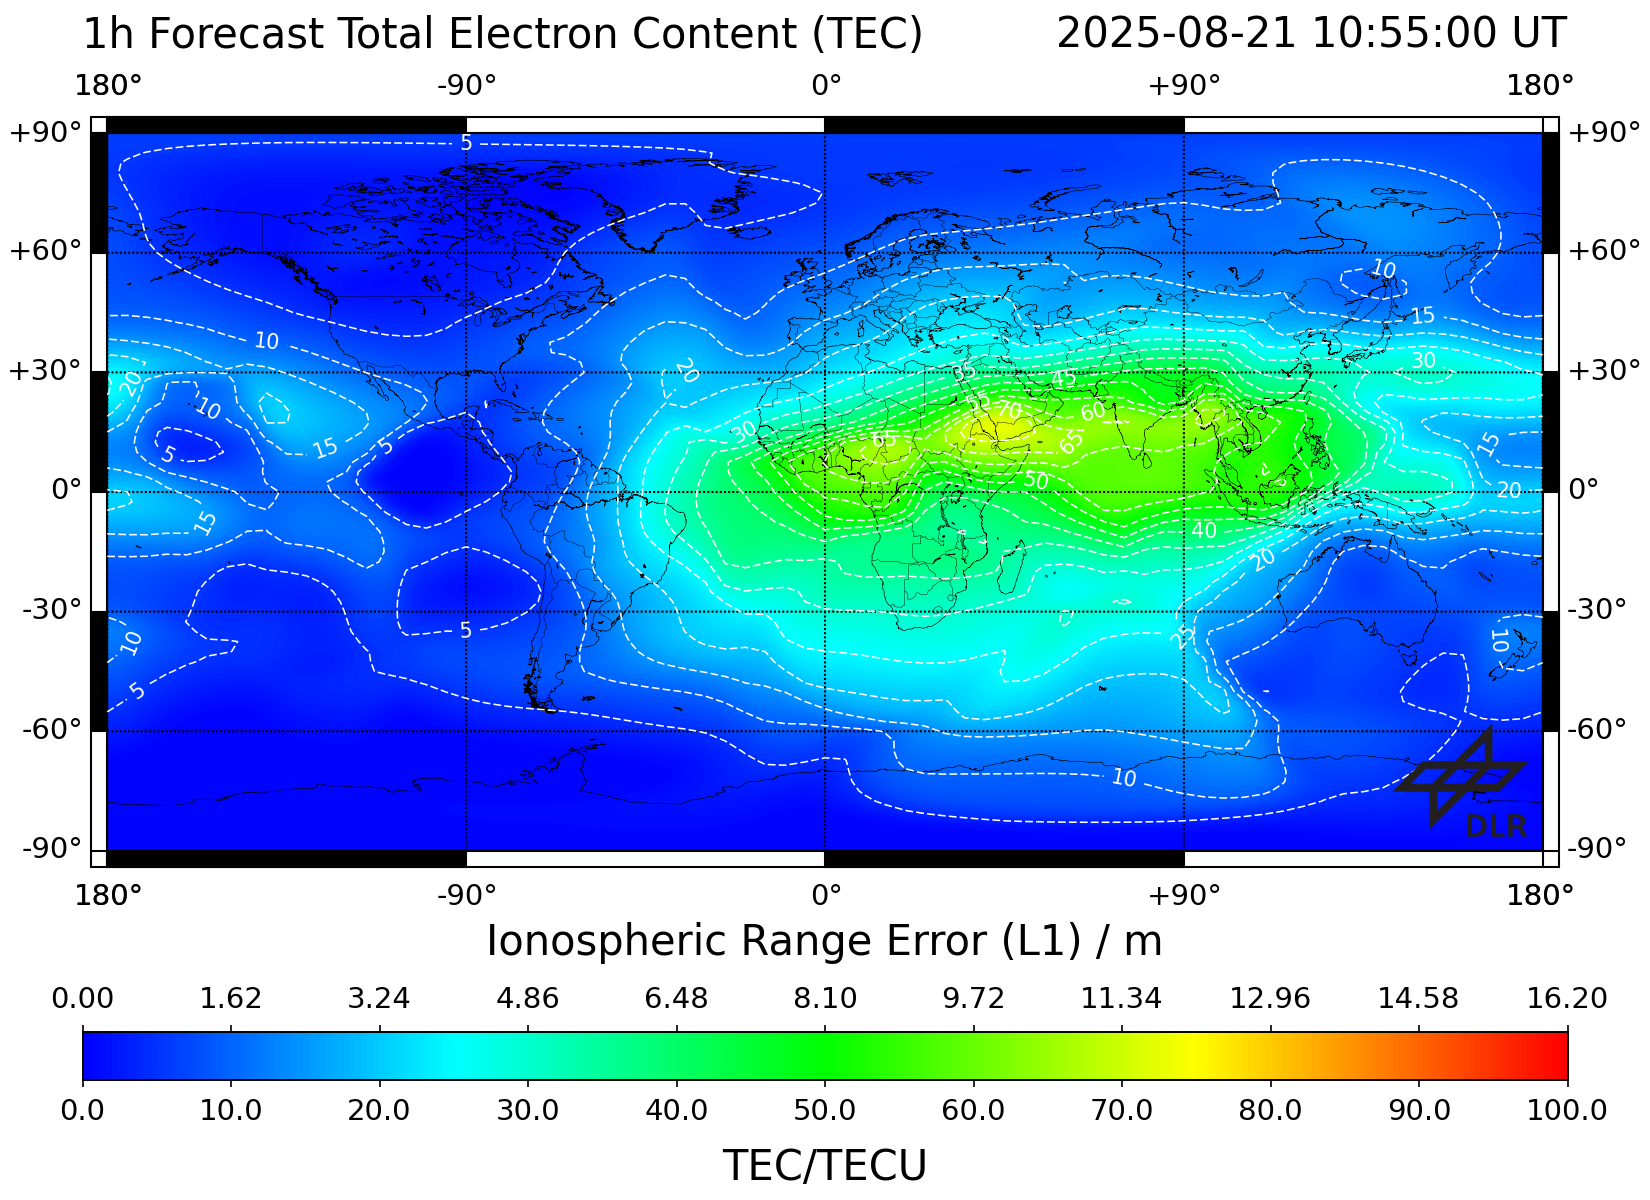
The 1 hour forecast TEC is provided in TEC units (1016 electrons per square meter) for a shell-height of 400 km.
Every 5 minutes a VTEC matrix with an ionospheric grid point spacing of 2.5° latitude x 5° longitude is generated and stored in ASCII format. Data is provided here with 15 minutes updated rate. Higher temporal resolution can be provided on request.
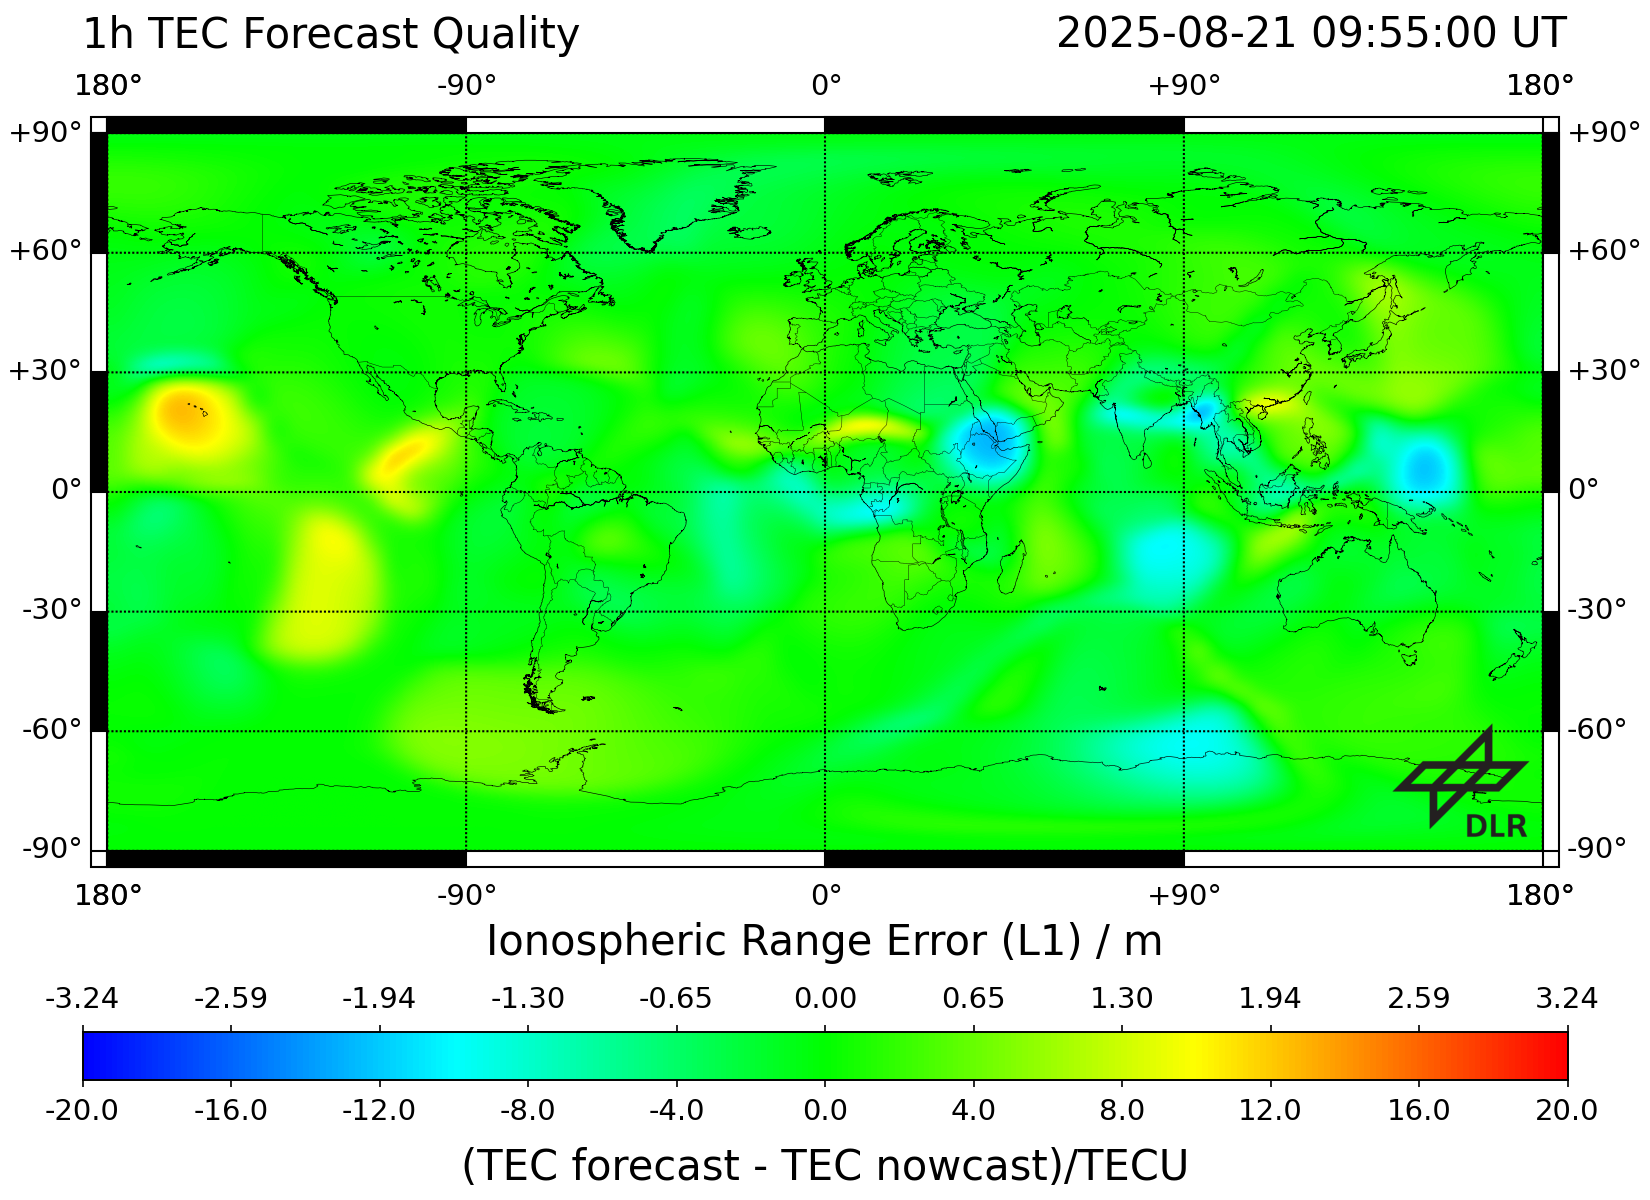
This product can be applied to help to improve the accuracy during GNSS positioning. Related validations can be found for instance in Minkwitz et al. (2014). The quality of the 24 hours forecast TEC map is estimated with the deviation between forecast and observation. These errors are monitored through the production pipeline and displayed in a forecast TEC error map. This forecast TEC error map is provided as quality information along with the product.
Product Specification
| Specification | Description |
|---|---|
| External parties | German Federal Agency for Cartography and Geodesy, data providers below |
| Data providers | IGS, Greenland network of the Technical University of Denmark |
| Input data | GPS dual-frequency measurements |
| Input sampling rates | 1 s |
| Reliability of data source | Data is preprocessed by DLR including e.g. cycle slip detection |
| Region of sensors | Global |
| Sensors | cf. station list |
| Single layer shell height | 400 km |
| Spatial Resolution | 2.5° Latitude x 5° Longitude |
| Boundaries of grid | -90°N – 90°N, 180°W – 180°E |
| Temporal Resolution | 15 min |
| Time Information | UTC Time |
| Reference coordinate System | ECEF coordinate system with WGS84 reference ellipsoid |
| Algorithms | The one hour forecast is calculated as a sum of the actual European TEC map and a weighted sum of the temporal TEC gradient of the previous hour and the temporal gradient of the previous day at the same time. |
| File format | ASCII |
| ASCII file format | Header line containing: unit of TEC values, UTC time, minimum latitude in degree, maximum latitude in degree, minimum longitude in degree, maximum longitude in degree, latitude step width in degree, longitude step width in degree, size of data matrix Data matrix with VTEC values in TECU (1e+16 electrons/m²): Upper left corner value represents the minimum longitude and maximum latitude; the lower right corner value represents the maximum longitude and minimum latitude value |
Quality Information
Error of the NRT TEC map, global, derived from errors of the GNSS measurements.